ANIRUDDHA

Infosys

Automated Insights

Automated Insights

An Infosys collaboration for AI Analytics & Smart Dashboards

Automating Data for better Finance, Retail & Business

SEPTEMBER 2023

MY ROLE

The Problem

The Problem

Merchandisers and finance teams are drowning in data from multiple sources but lack the time and tools to extract key insights quickly. They need a dashboard that not only visualizes KPIs but explains trends in simple language, enabling faster, more confident decisions.

The Challenge

The Challenge

Infosys needed a system that would:

  • Ingest data from multiple structured sources.

  • Automatically analyze, rank, and summarize insights.

  • Communicate these insights & Handoff to Team Infosys.

  • Support finance use cases with interactive, explorable dashboards.

TOOLS

IMPACT

30%

30%

A reduction in average task time was observed.

85+

85+

of SUS (System Usability Scale) usability score was achieved

of SUS usability score was achieved

Featuring use of Auto Layouts for Responsiveness, Design System

Stepwise brief of Dashboard
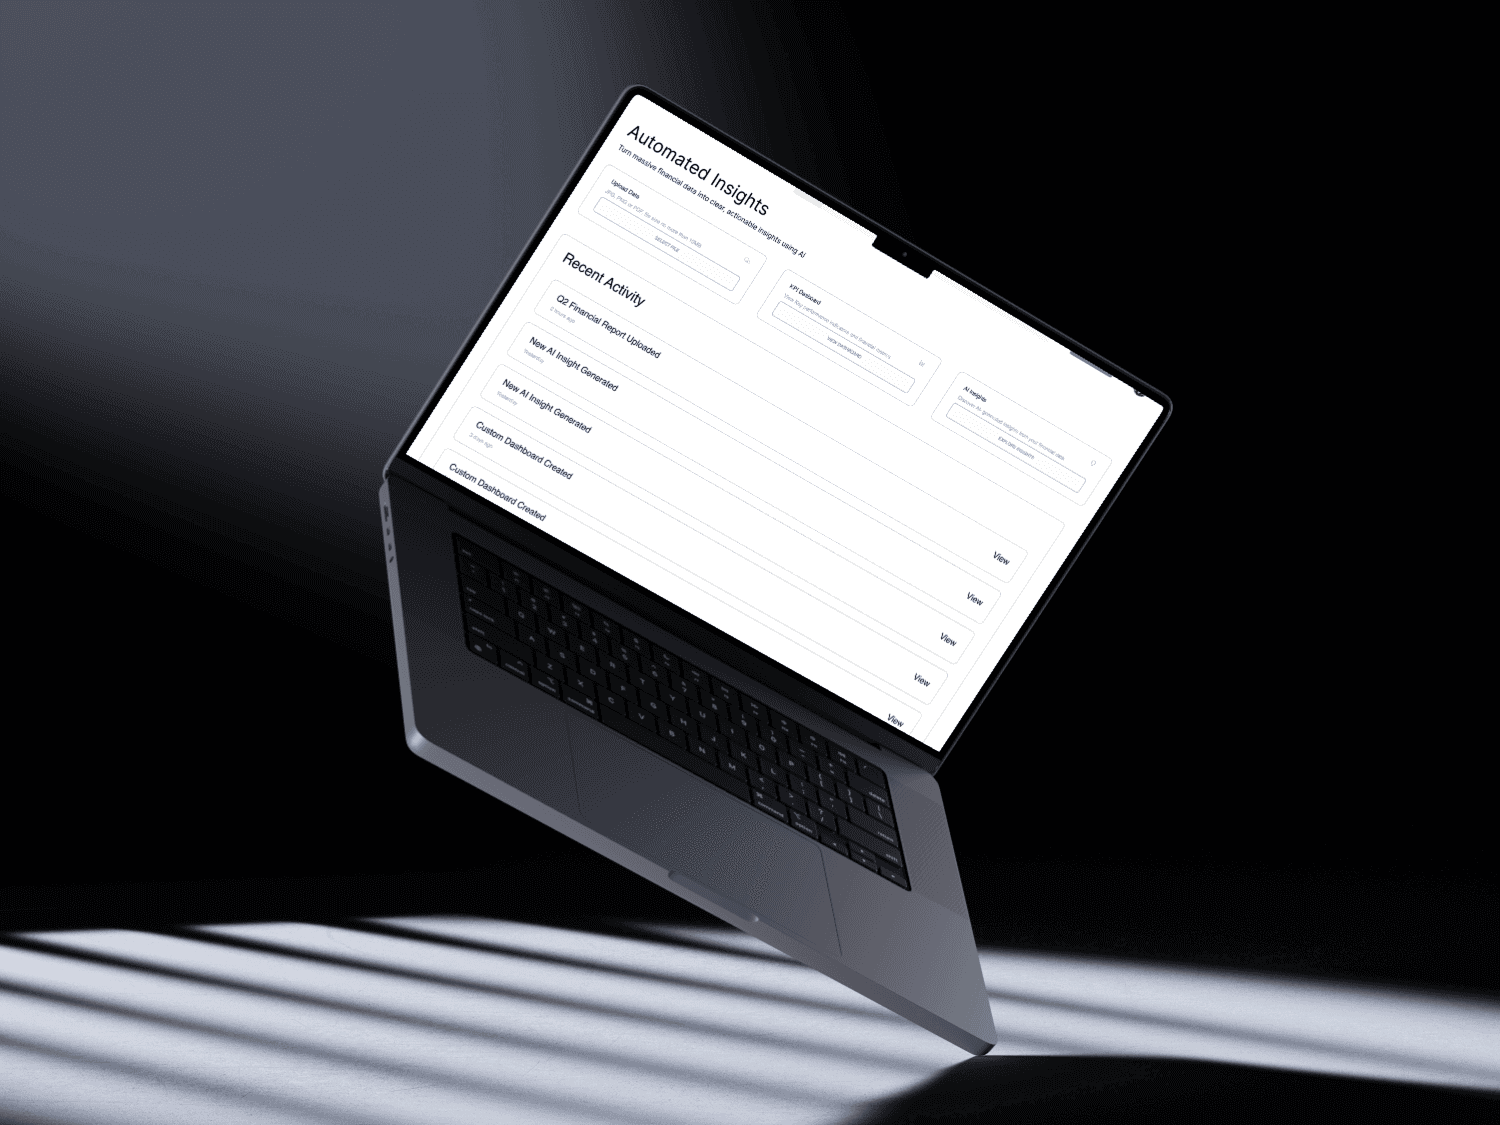
Showcased is a 4-Step Breakdown of the Automated Insights Dashboard presented to Infosys Retail

Showcased is a 4-Step Breakdown of the Automated Insights Dashboard presented to Infosys Retail

Multi Source

Upload Data from Multiple Sources

Users can upload or connect data from Excel sheets, cloud APIs, databases, or even social/media files.

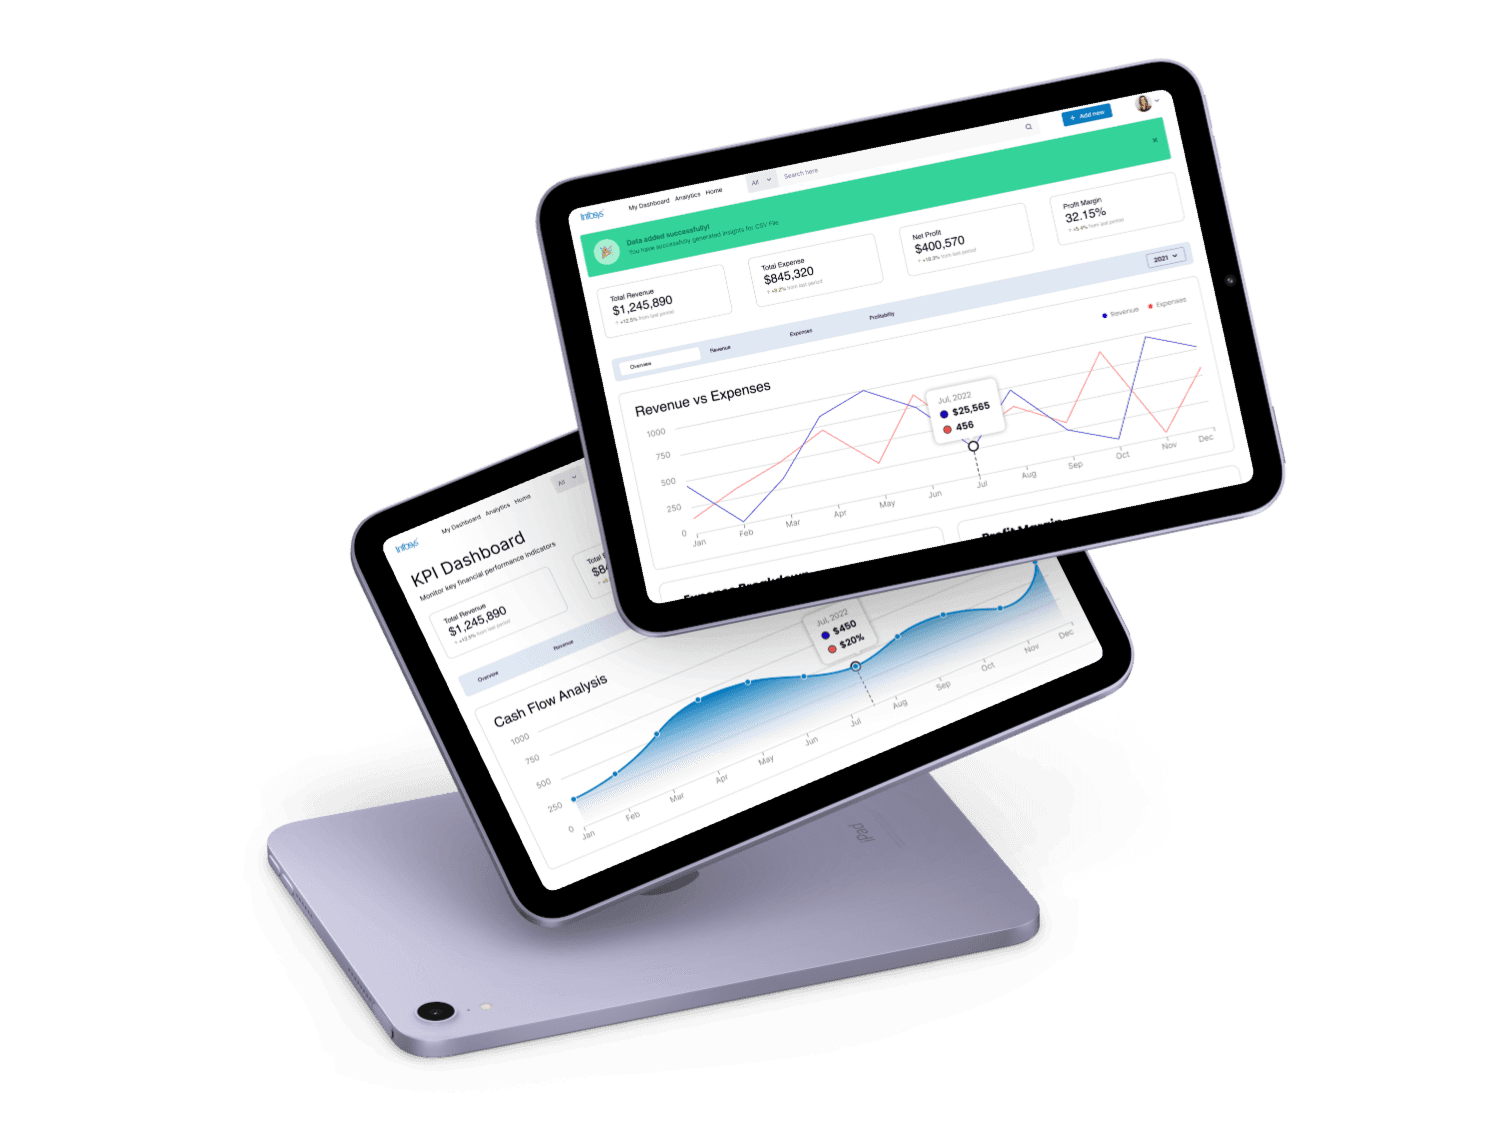
Interactive Visual Dashboards
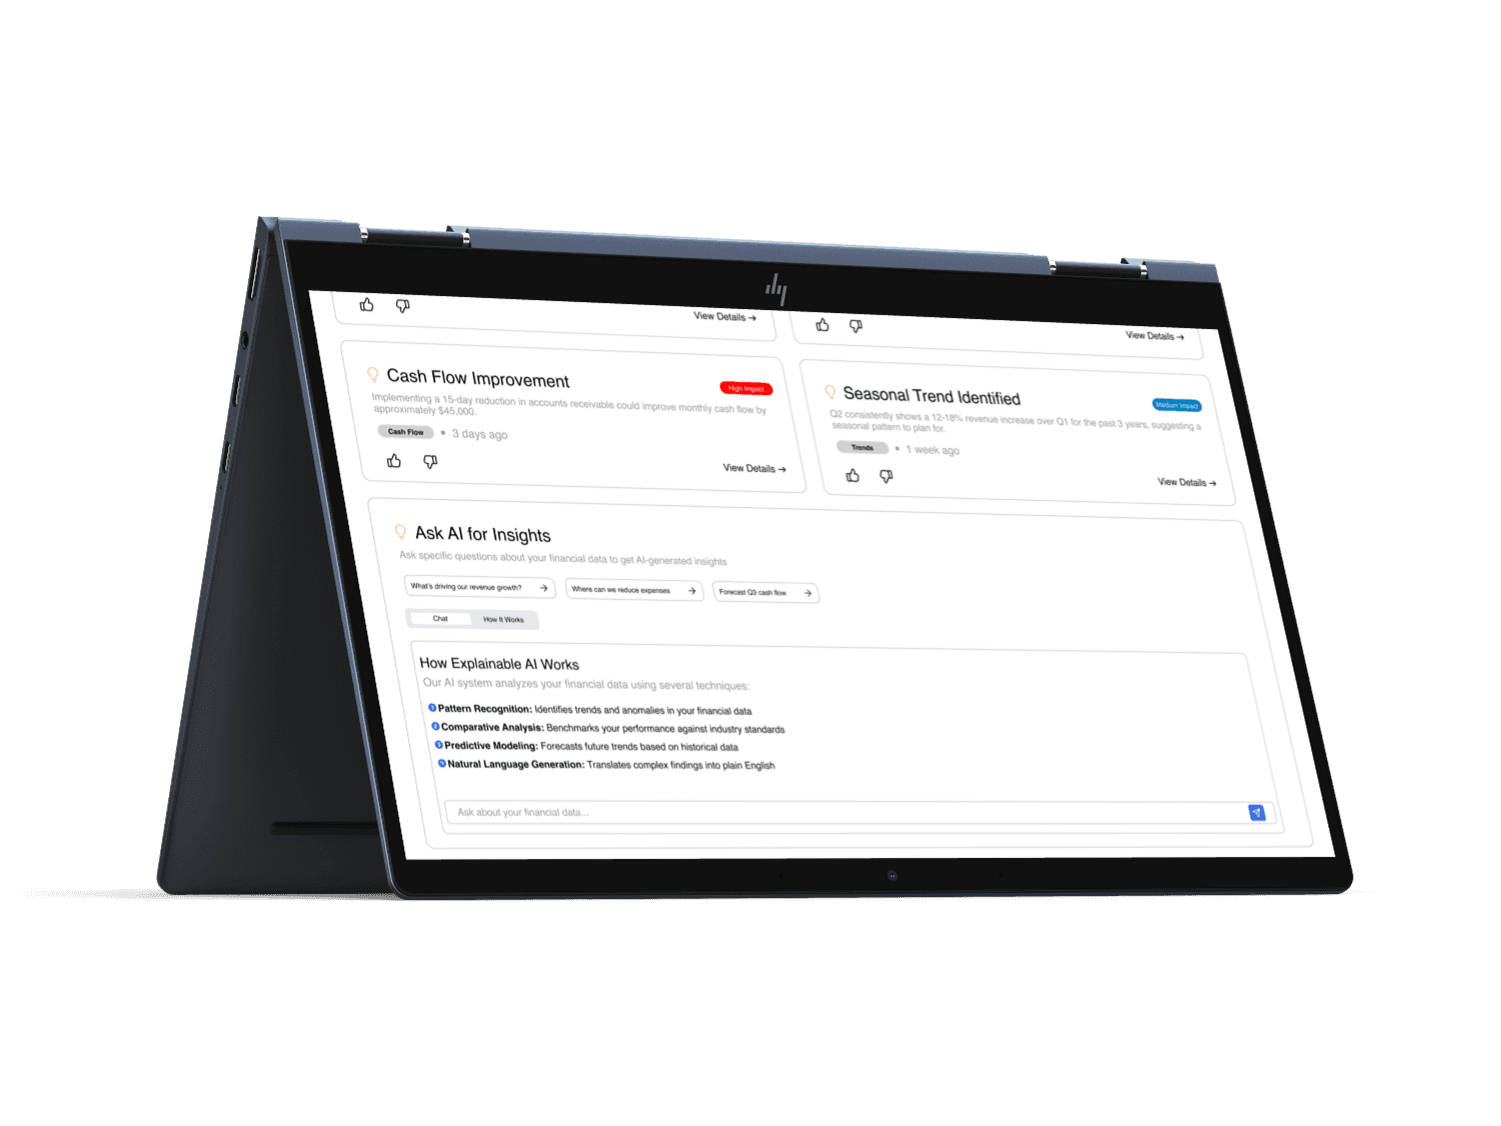
Users can interact with charts, filter by region/product/timeframe, and visualize trends or deep-dive into key areas.

The course follows and explains 5 Planes laid out by author JJ Garrett in her book The Elements of User Experience, ensuring material is solid always updated & reflective of the latest trends.

AI Integration

AI-Generated Insights with Natural Language

The AI engine auto-generates key insights from the data and explains them in plain English — e.g.,

“Revenue grew by 22% in Q3 driven by electronics in the West.”

Export, Share, and Give Feedback

Insights can be bookmarked, exported to PDF/Slides, and shared across teams. Users can also give feedback to improve insight accuracy over time.

Share Feedback

Ease

Dashboard Design

Dashboard Design

Dashboard Design

Here is a video explaining what Infosys provided us—yes, even the raw code—and how we transformed it!

Here is a video explaining what Infosys provided us—yes, even the raw code—and how we transformed it!

Want to work together?

Want to work together?

Feel free to reach out at

Feel free to reach out at

Create a free website with Framer, the website builder loved by startups, designers and agencies.