Role: Graphic Designer/Data Visualizer
Design: Book Layouts, Cover Pages, Conceptual development, Data storytelling, Layout Design, Typography, Visualizations, Data Analysis
Duration: 7 Days
Toolkit:Excel, PowerBI, Adobe Indesign, Photoshop, IssuU
Project Type: Self-driven Project
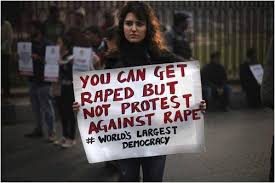
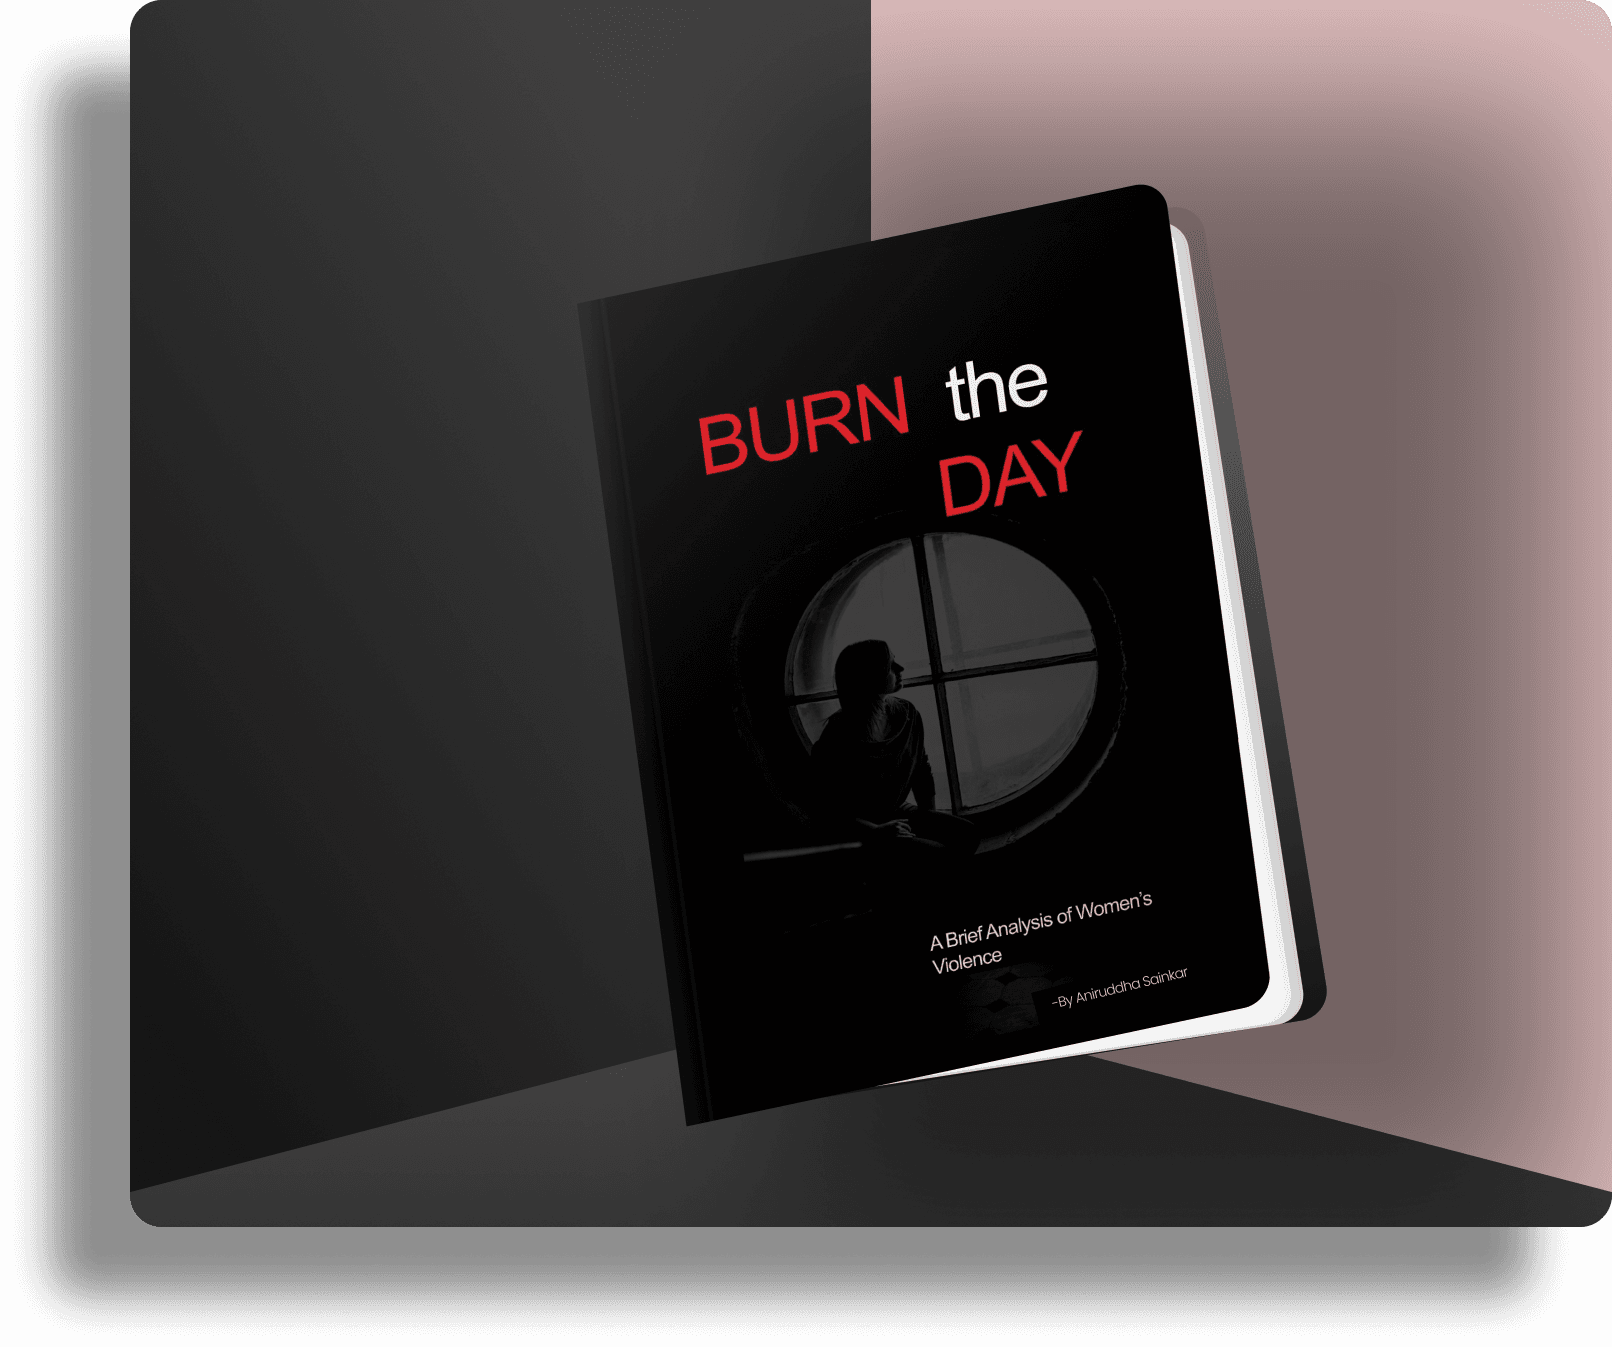
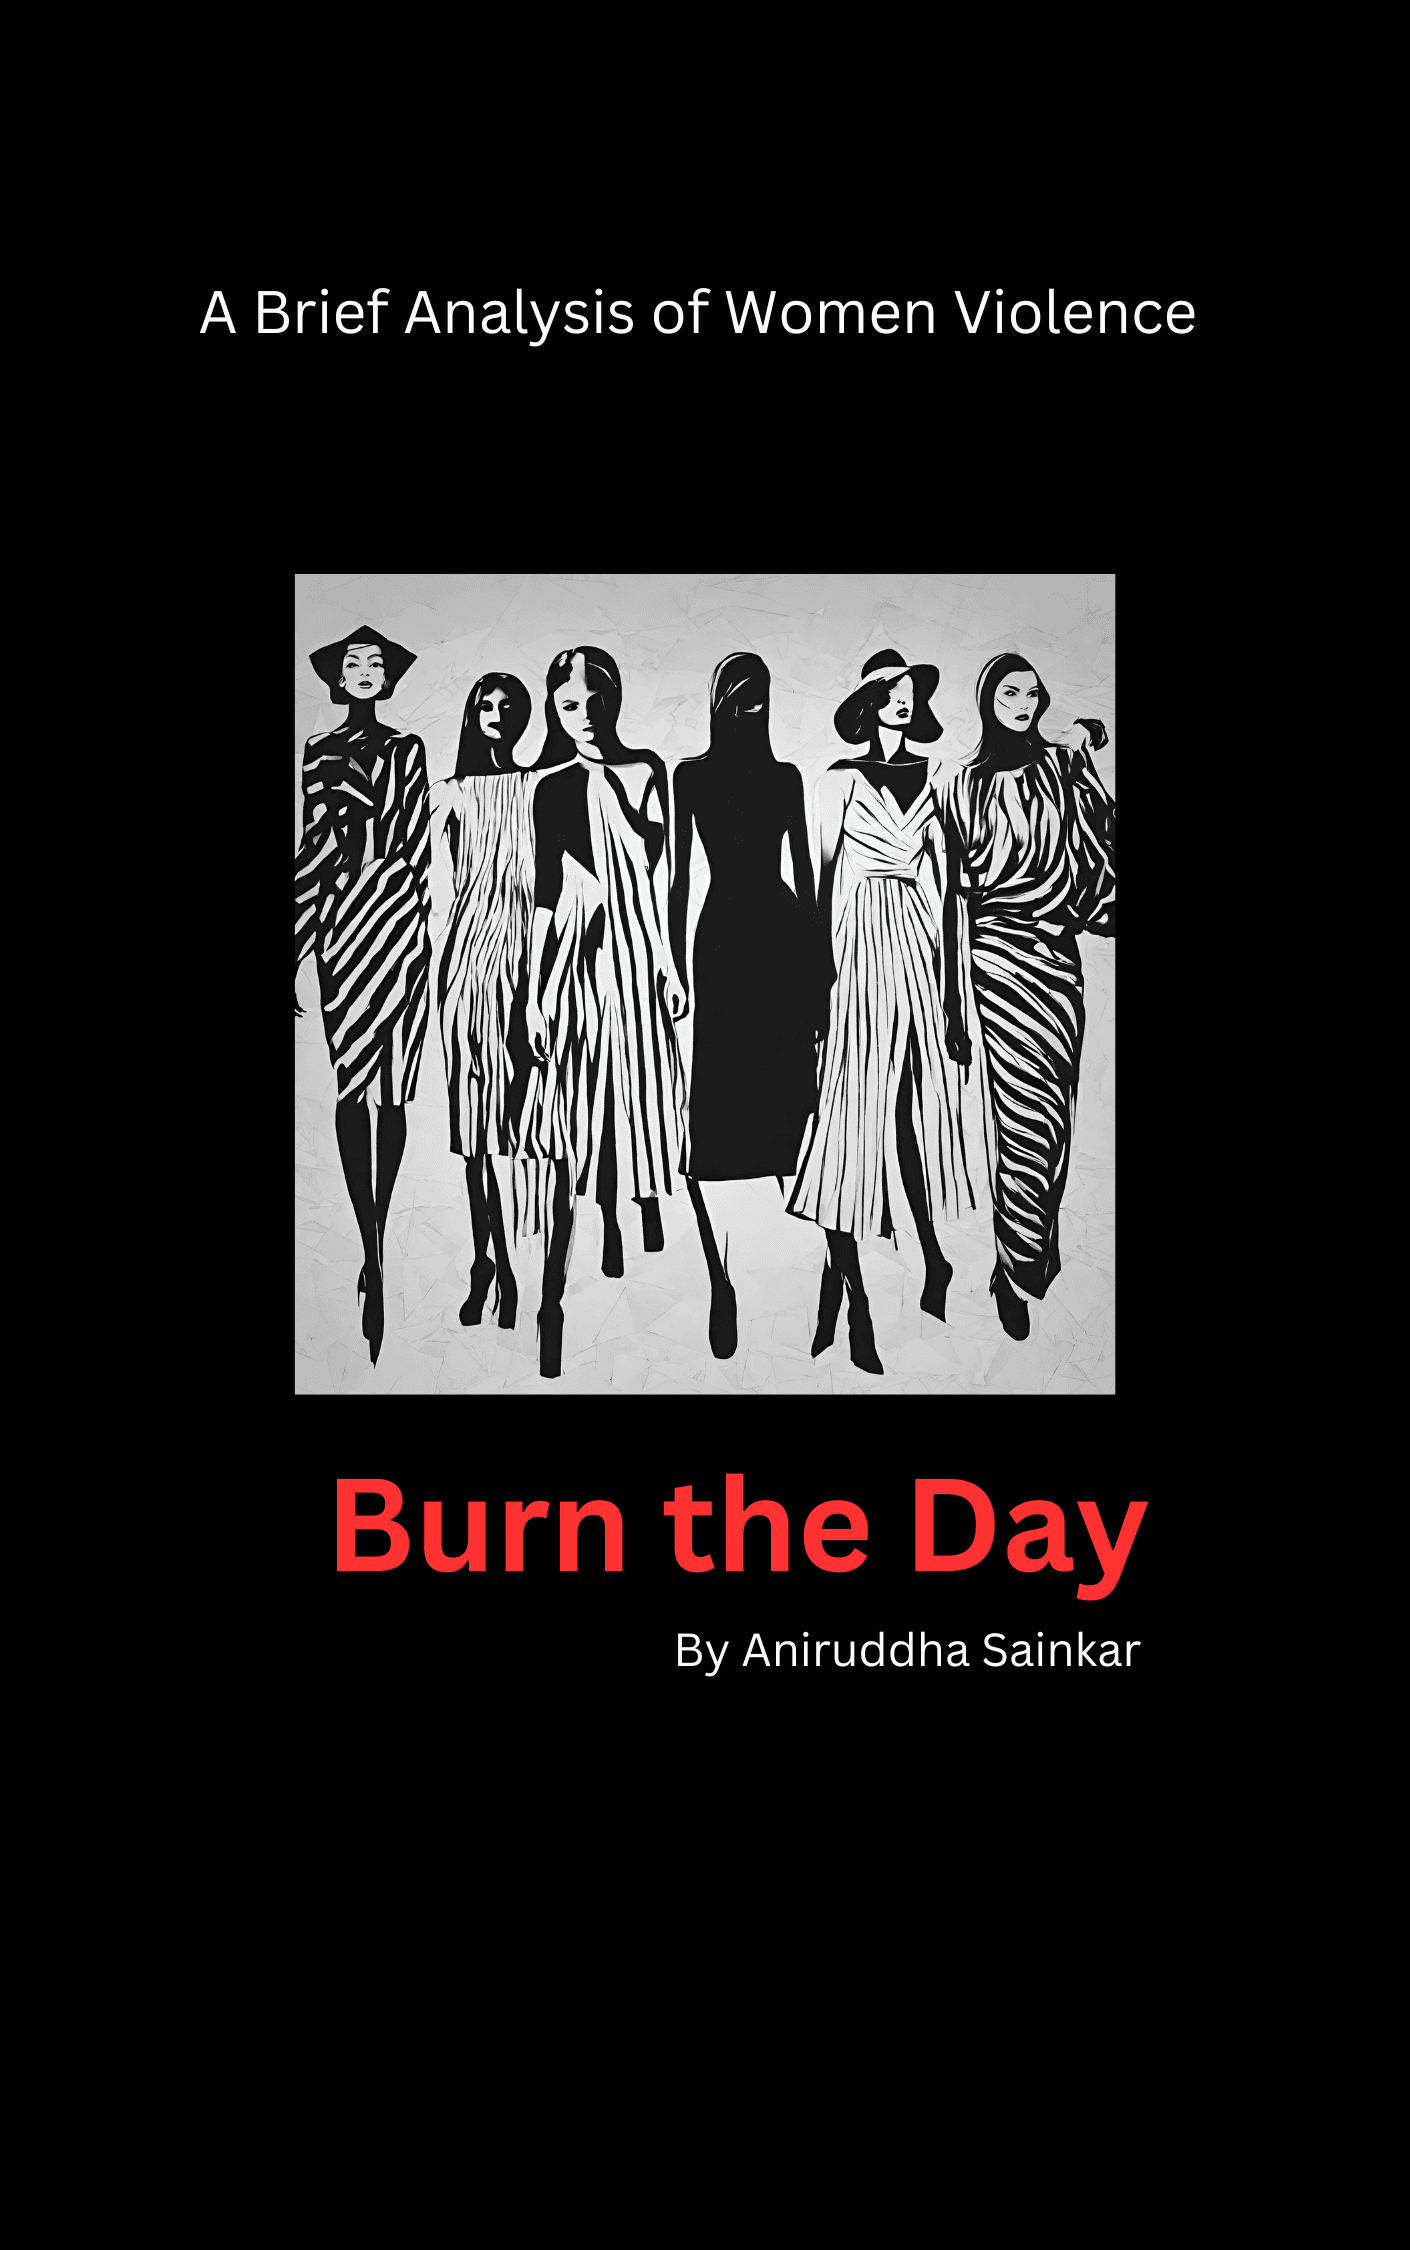
The book researches the issue of violence against women in India by gathering information from a variety of sources
It specifically focuses on examining the rates of criminal convictions related to these incidents and utilizes a range of data visualizations and analyses to substantiate its claims.
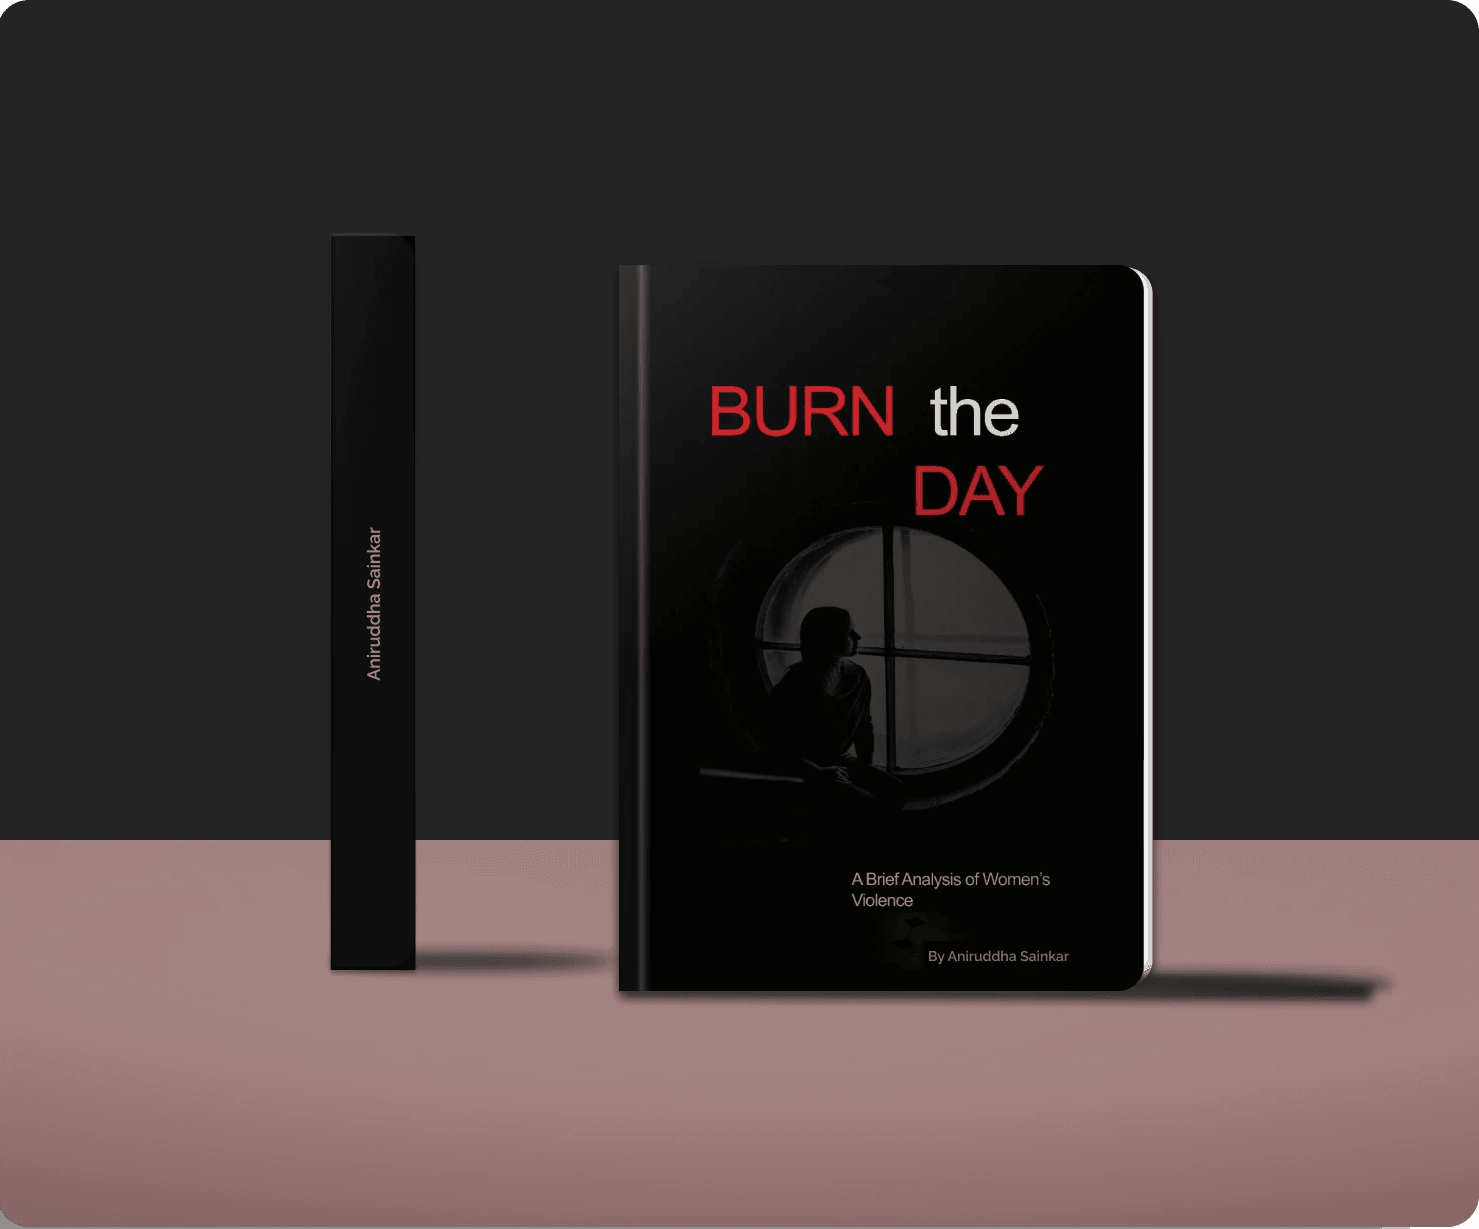
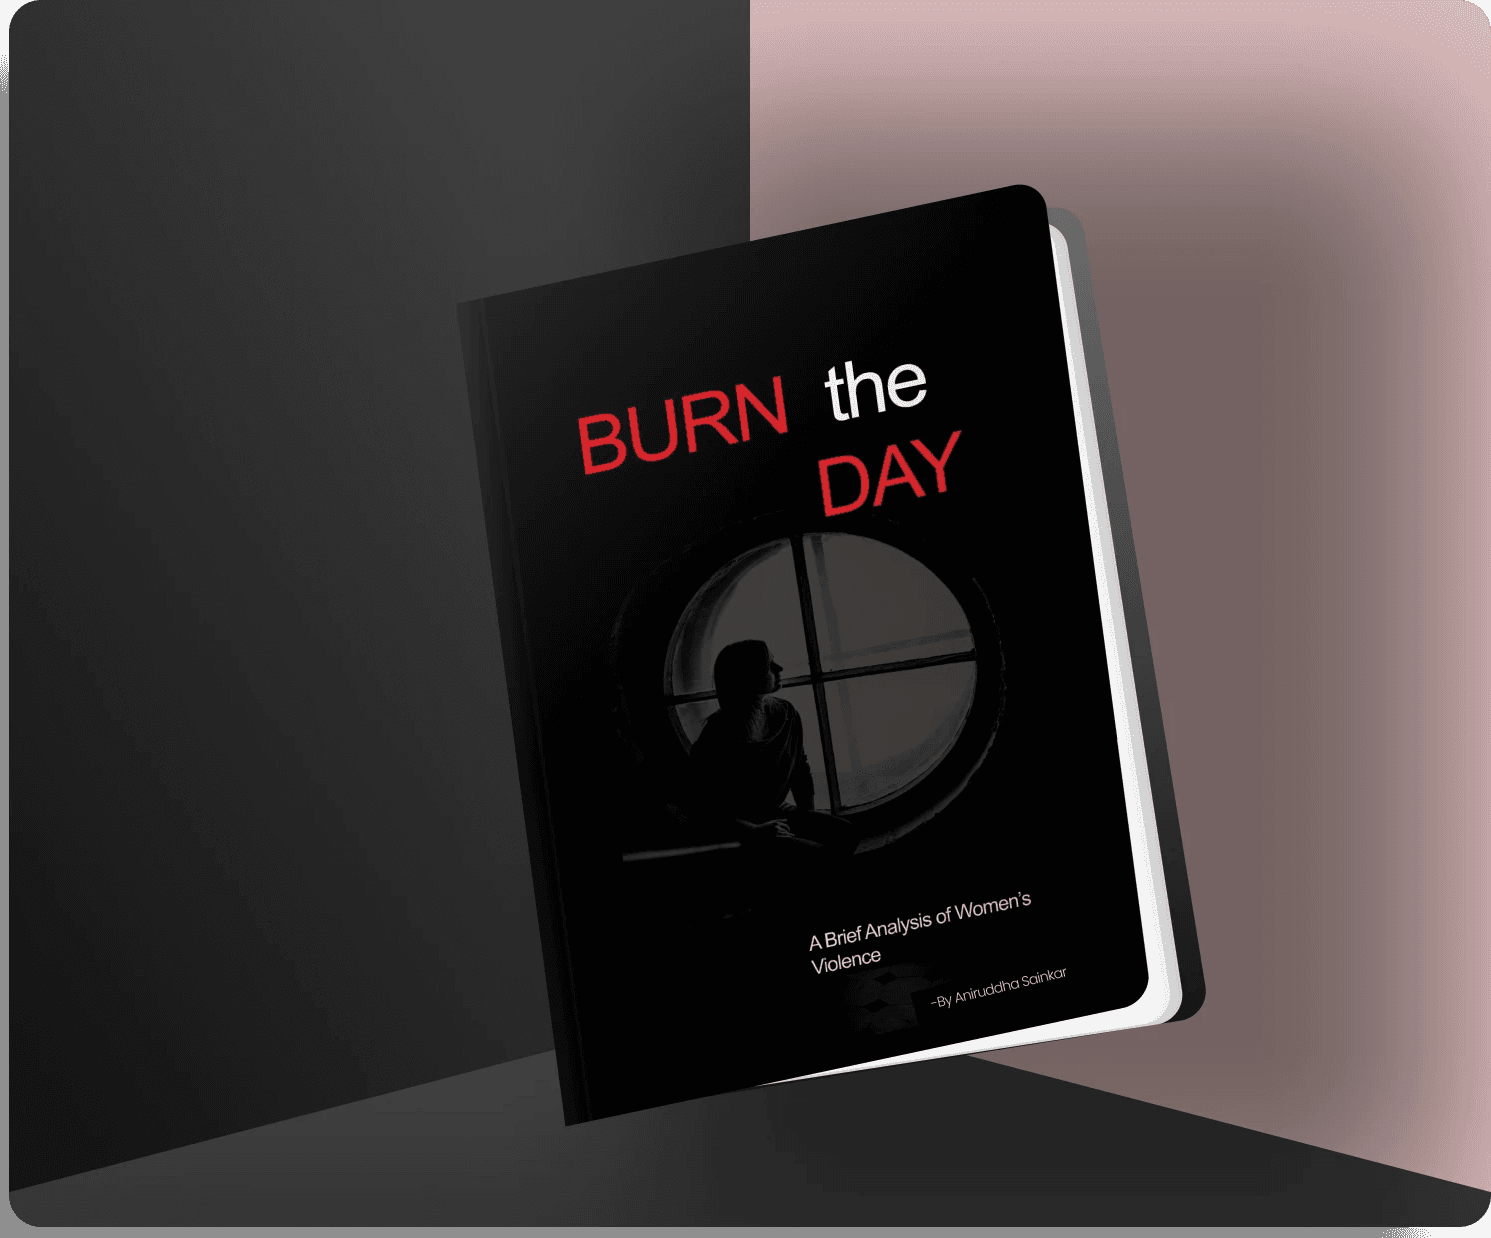
To maintain a sense of fairness in addressing this sensitive topic and ensure broad appeal, the book features a monochromatic cover and employs a warm yet minimal color palette, complemented by strong visual graphics and typography in an unconventional layout design.
Book Overview
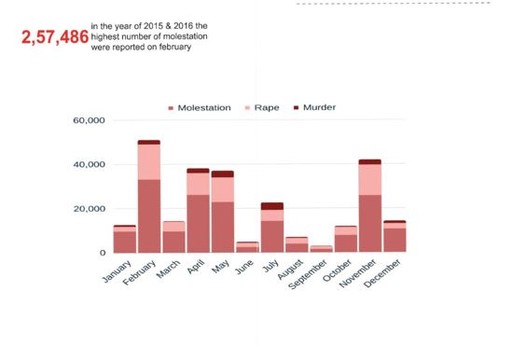
The total number of violent incidents in 2016 was among the most ever recorded at 1,32,122, a 67.58% rise from the previous year.
To comprehend how a delicate subject might be represented with data, it is crucial to analyze and visualize this data.
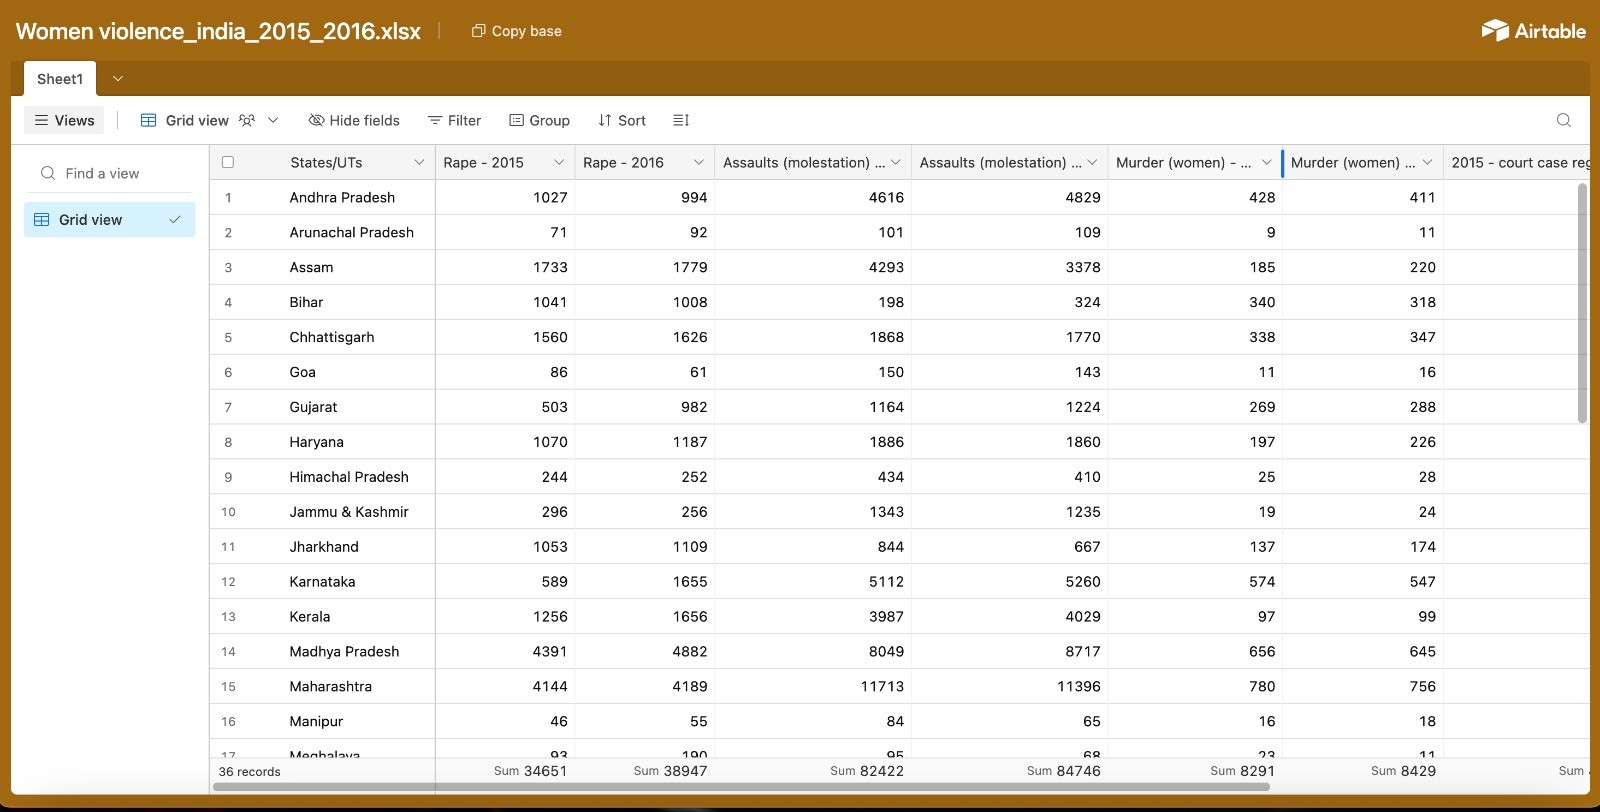
The dataset mentioned above is obtained from the source "Mapping Women Violence".
This dataset includes various details, such as state names, the number of reported and unreported cases, year-wise statistics on molestation, rape, and murder cases, and more.
This dataset was later analyzed using PowerBI to get the desired information.
The Dataset
Women violence
Who?
Adults
Mid age Women
Girls
Rape
Molestation
Murder
Gender Inequality
Lack of education
Substance abuse
Social stigma
Peer pressure
Physiological factors
Cultural beliefs
Lack of support service
How?
Why?
How to stop women abusement
Which age groups are targeted?
Does any particular factor play an important role in the number of violence?
What are the states are highest in crime?
What is the ratio of taking legal action
Would change in rules help?

Introduction
A brief introduction about women violence in India. Discuss about what are the 4 facts of brutalism
Creating a narrative
The objective is to establish a structure within the data and transform it into visuals according to the sections.
This guarantees that the information presented follows a storytelling sequence, effectively communicating the infographic and conclusion in a clear and noticeable manner.
Observing Trend
Demographic Study
Conviction Rate
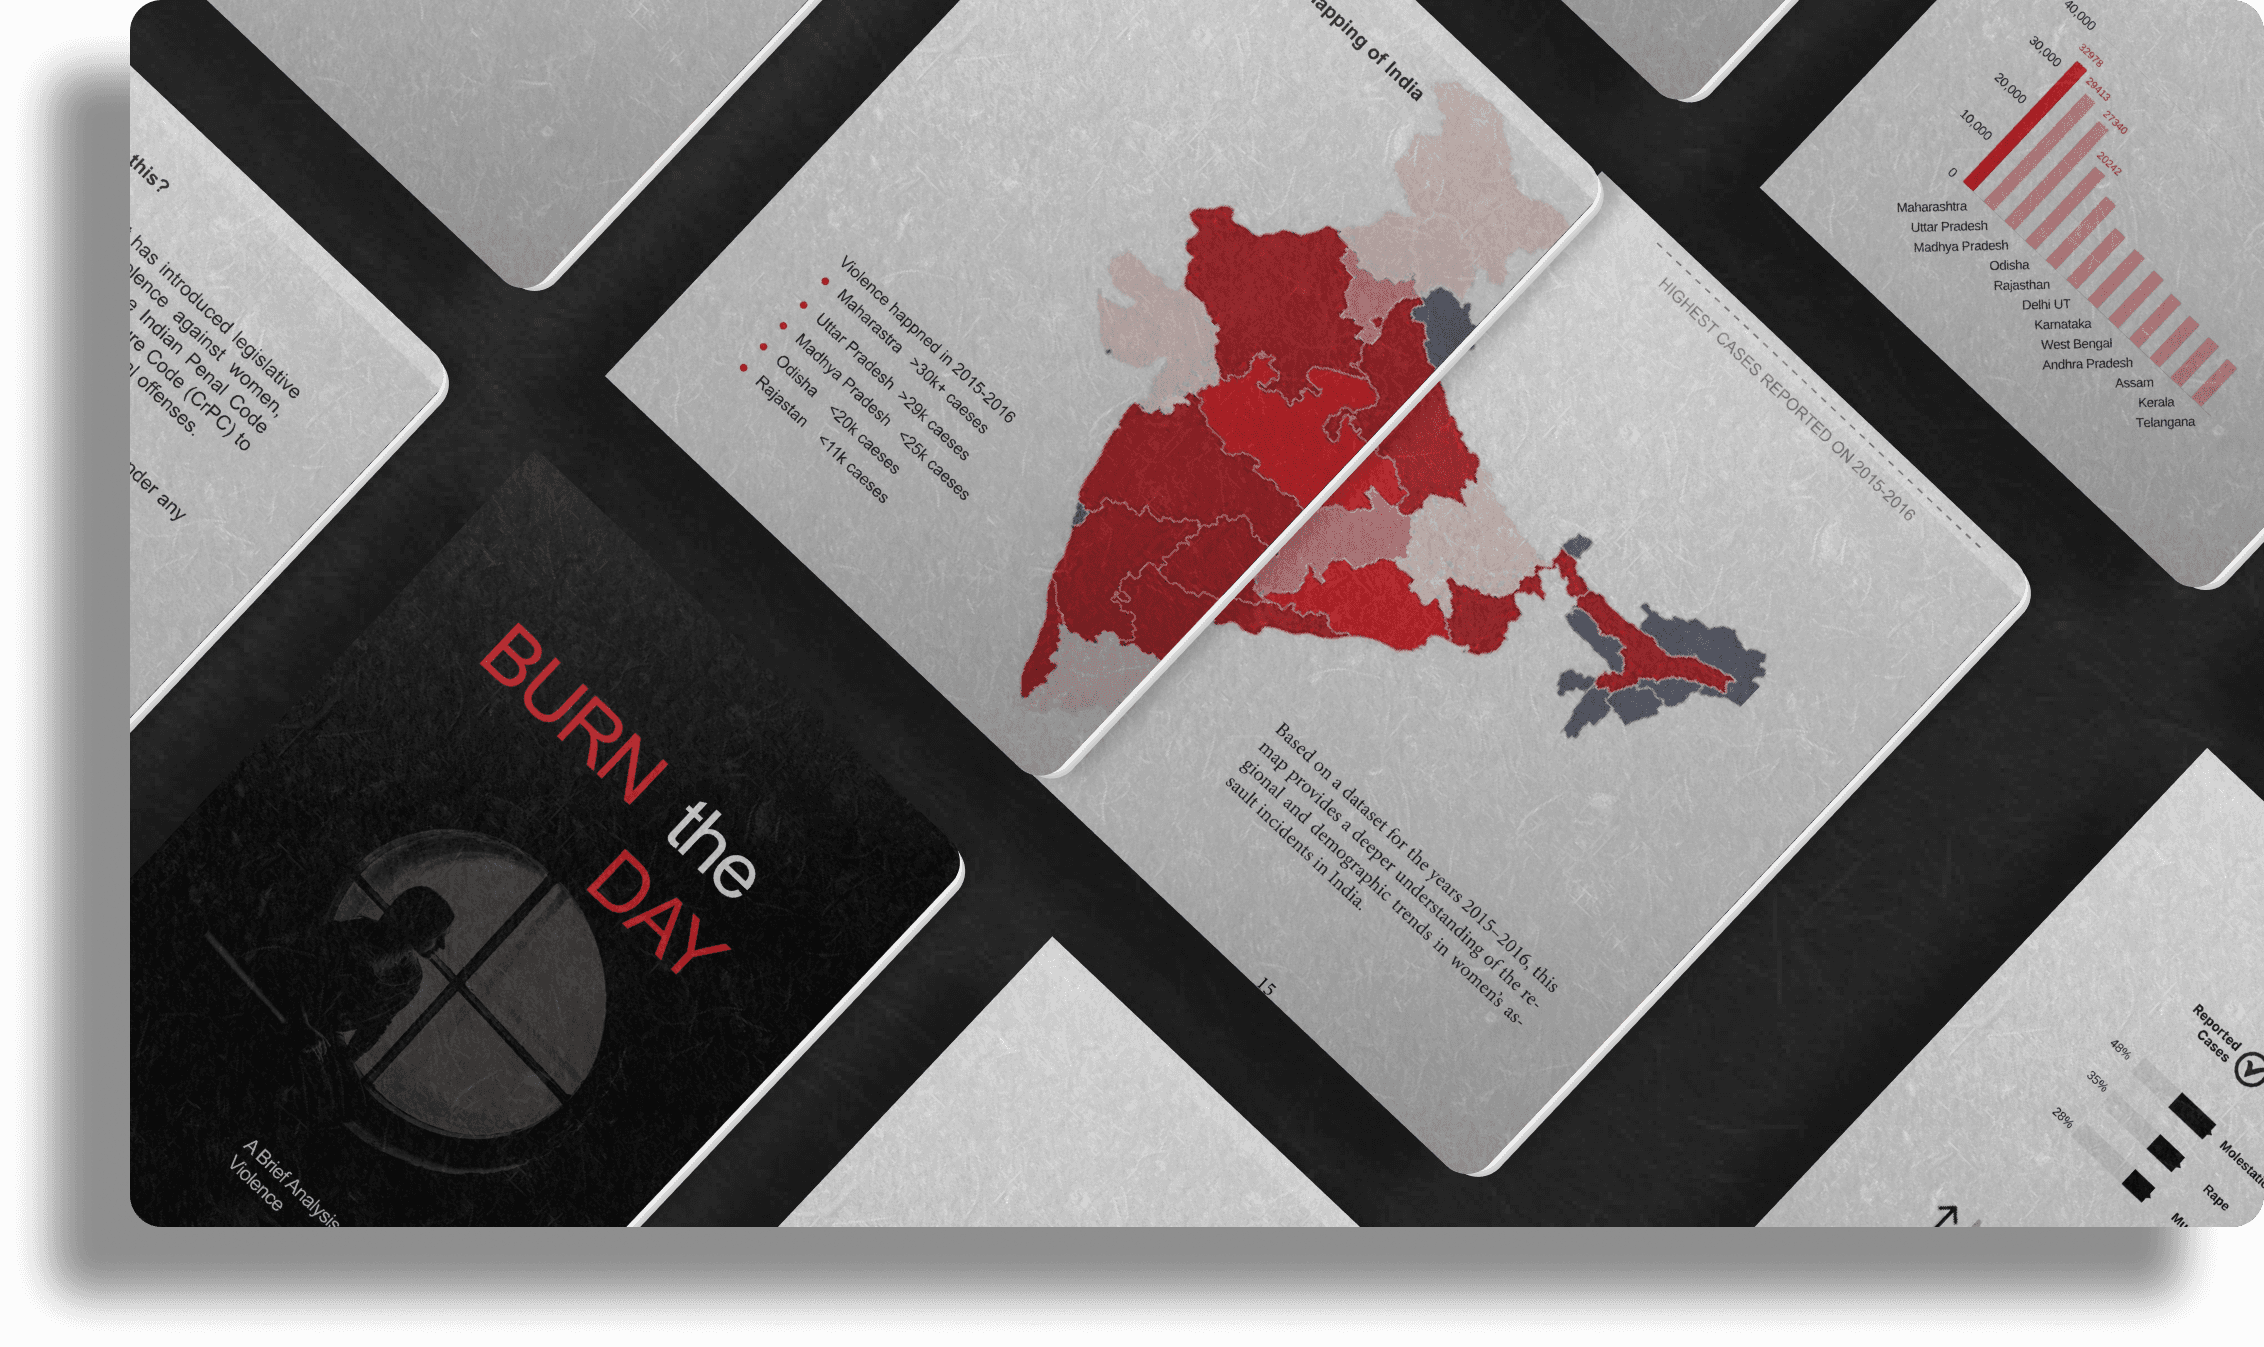
The study displays a statistical analysis of the number of murders, rapes, and molestation based on annual data.
Examining state-based patterns, targeted victims ratios to analyze the women violence
The research aimed to comprehend whether India offers any legal measures/actions, and the proportion of cases that are reported
This research examines the prevalence and extent of harassment, taking into account different age groups and changes across states from 2015 to 2016.
Furthermore, it goes deeper into the analysis of conviction cases to gain insights int It also explores the factors contributing to cases not reaching the courts and the likelihood of the accused ever attaining justice.
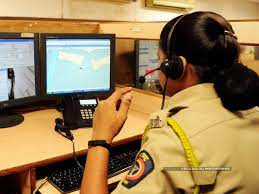
Who do you call
when feel unsafe?
Theme color
Contrast Color
Color Palatte

The final cover of the book
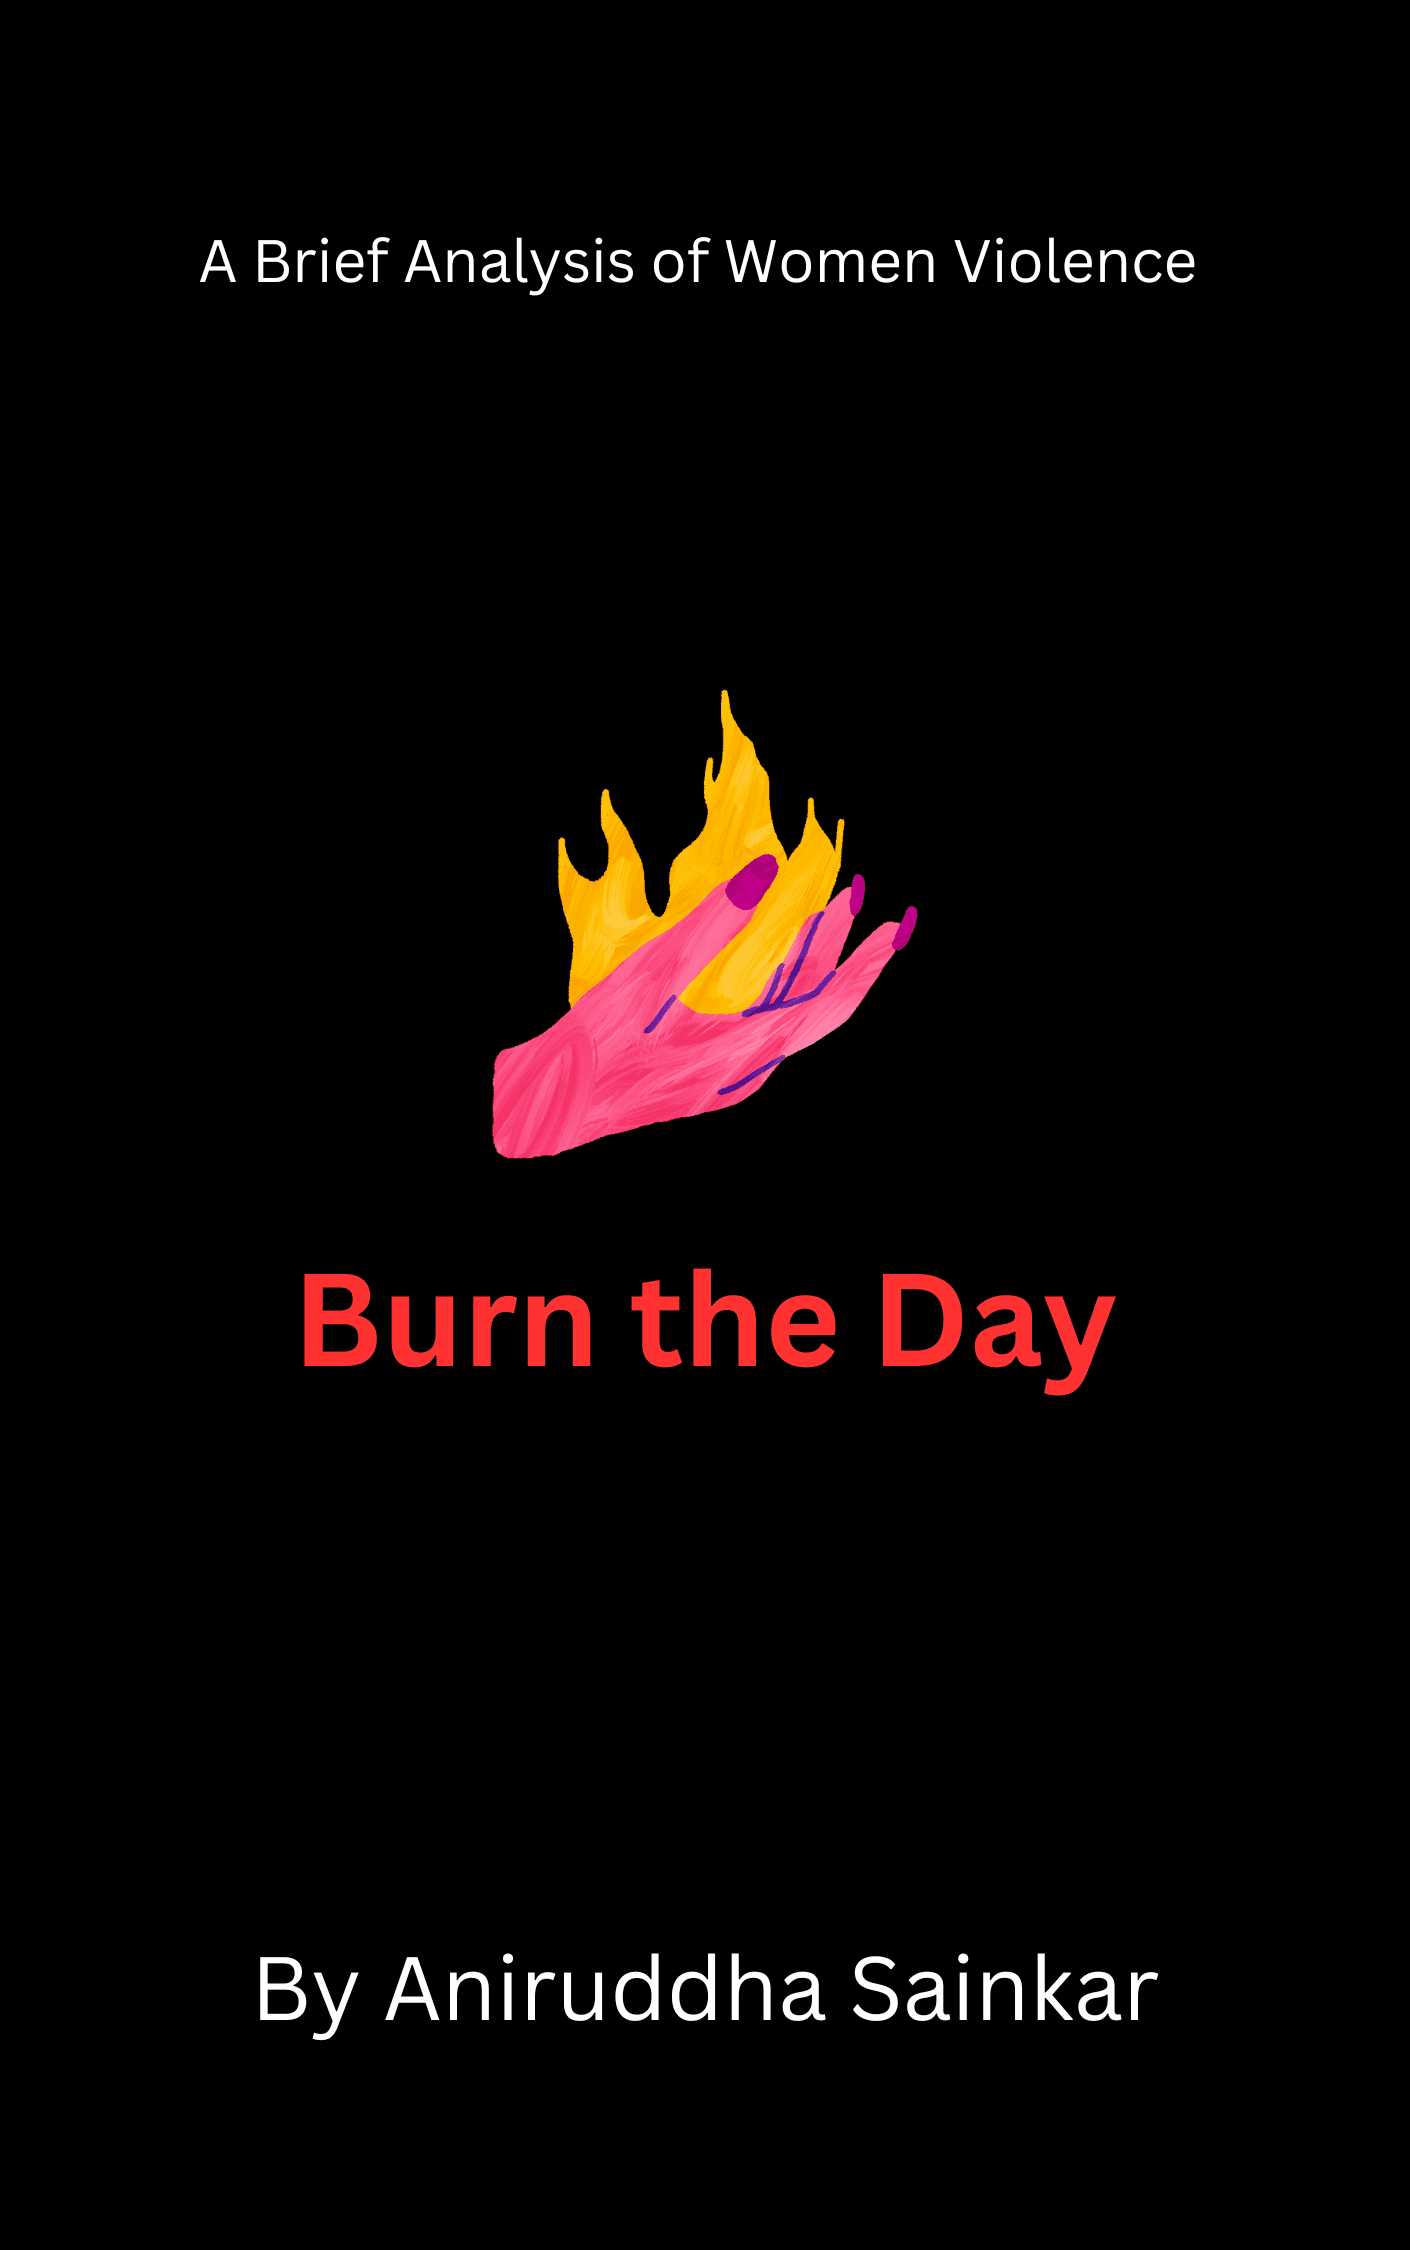
Design Methodology #2: Cover Page Exploration
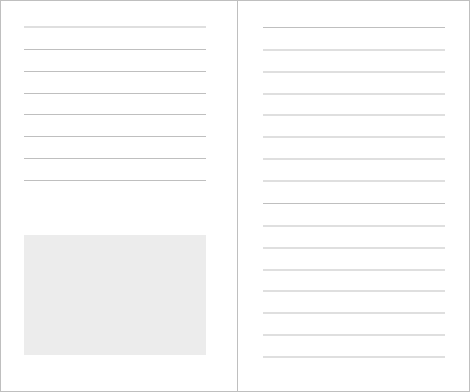
Design Methodology #1: Layout Explorations
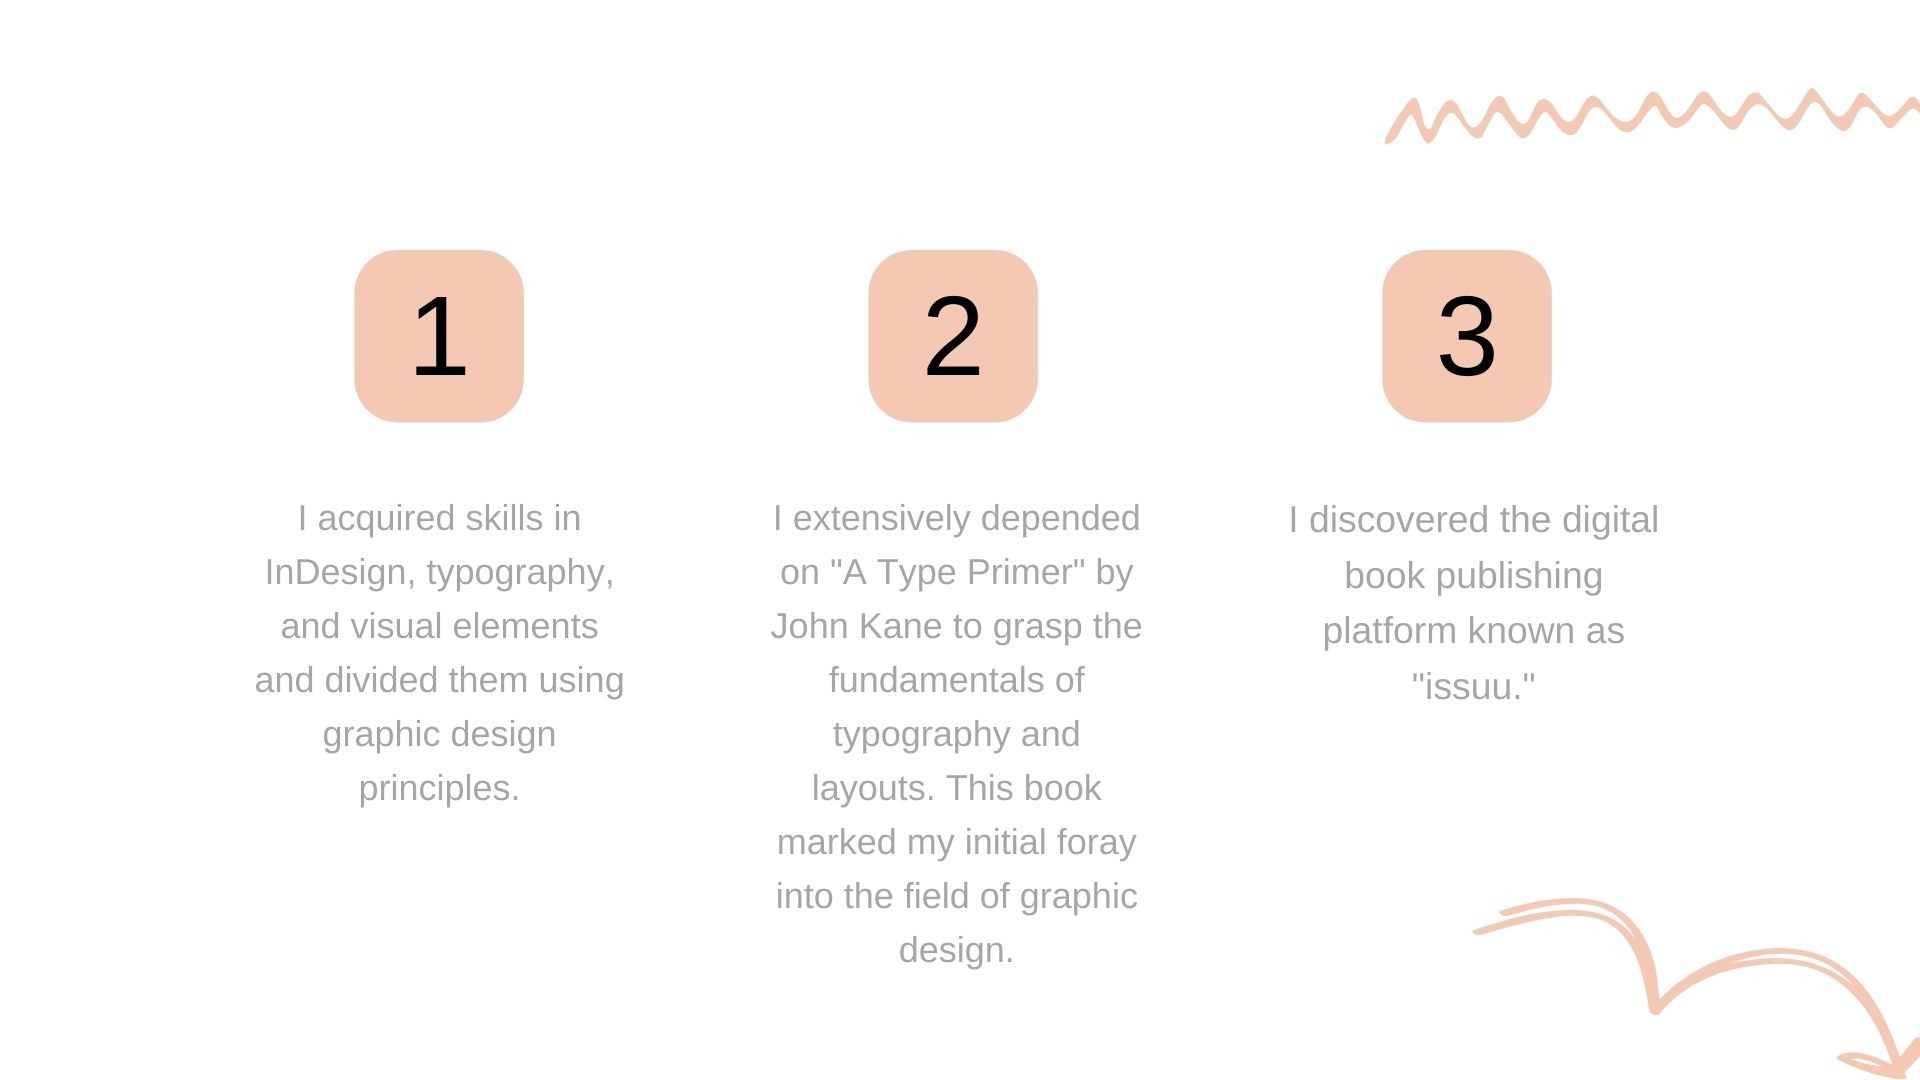
As I explored various layout approaches with text and images, I aimed to enhance readability and uniformity in the book about police brutality. I developed low-fidelity wireframes as a blueprint, ensuring design aspects remained harmonious throughout. The objective was to produce a series of layouts for the book, assessed for their efficacy in delivering the intended message. The thoughtful placement of text and visuals culminated in a design that was visually appealing, user-friendly, and reinforced the book's overall theme.
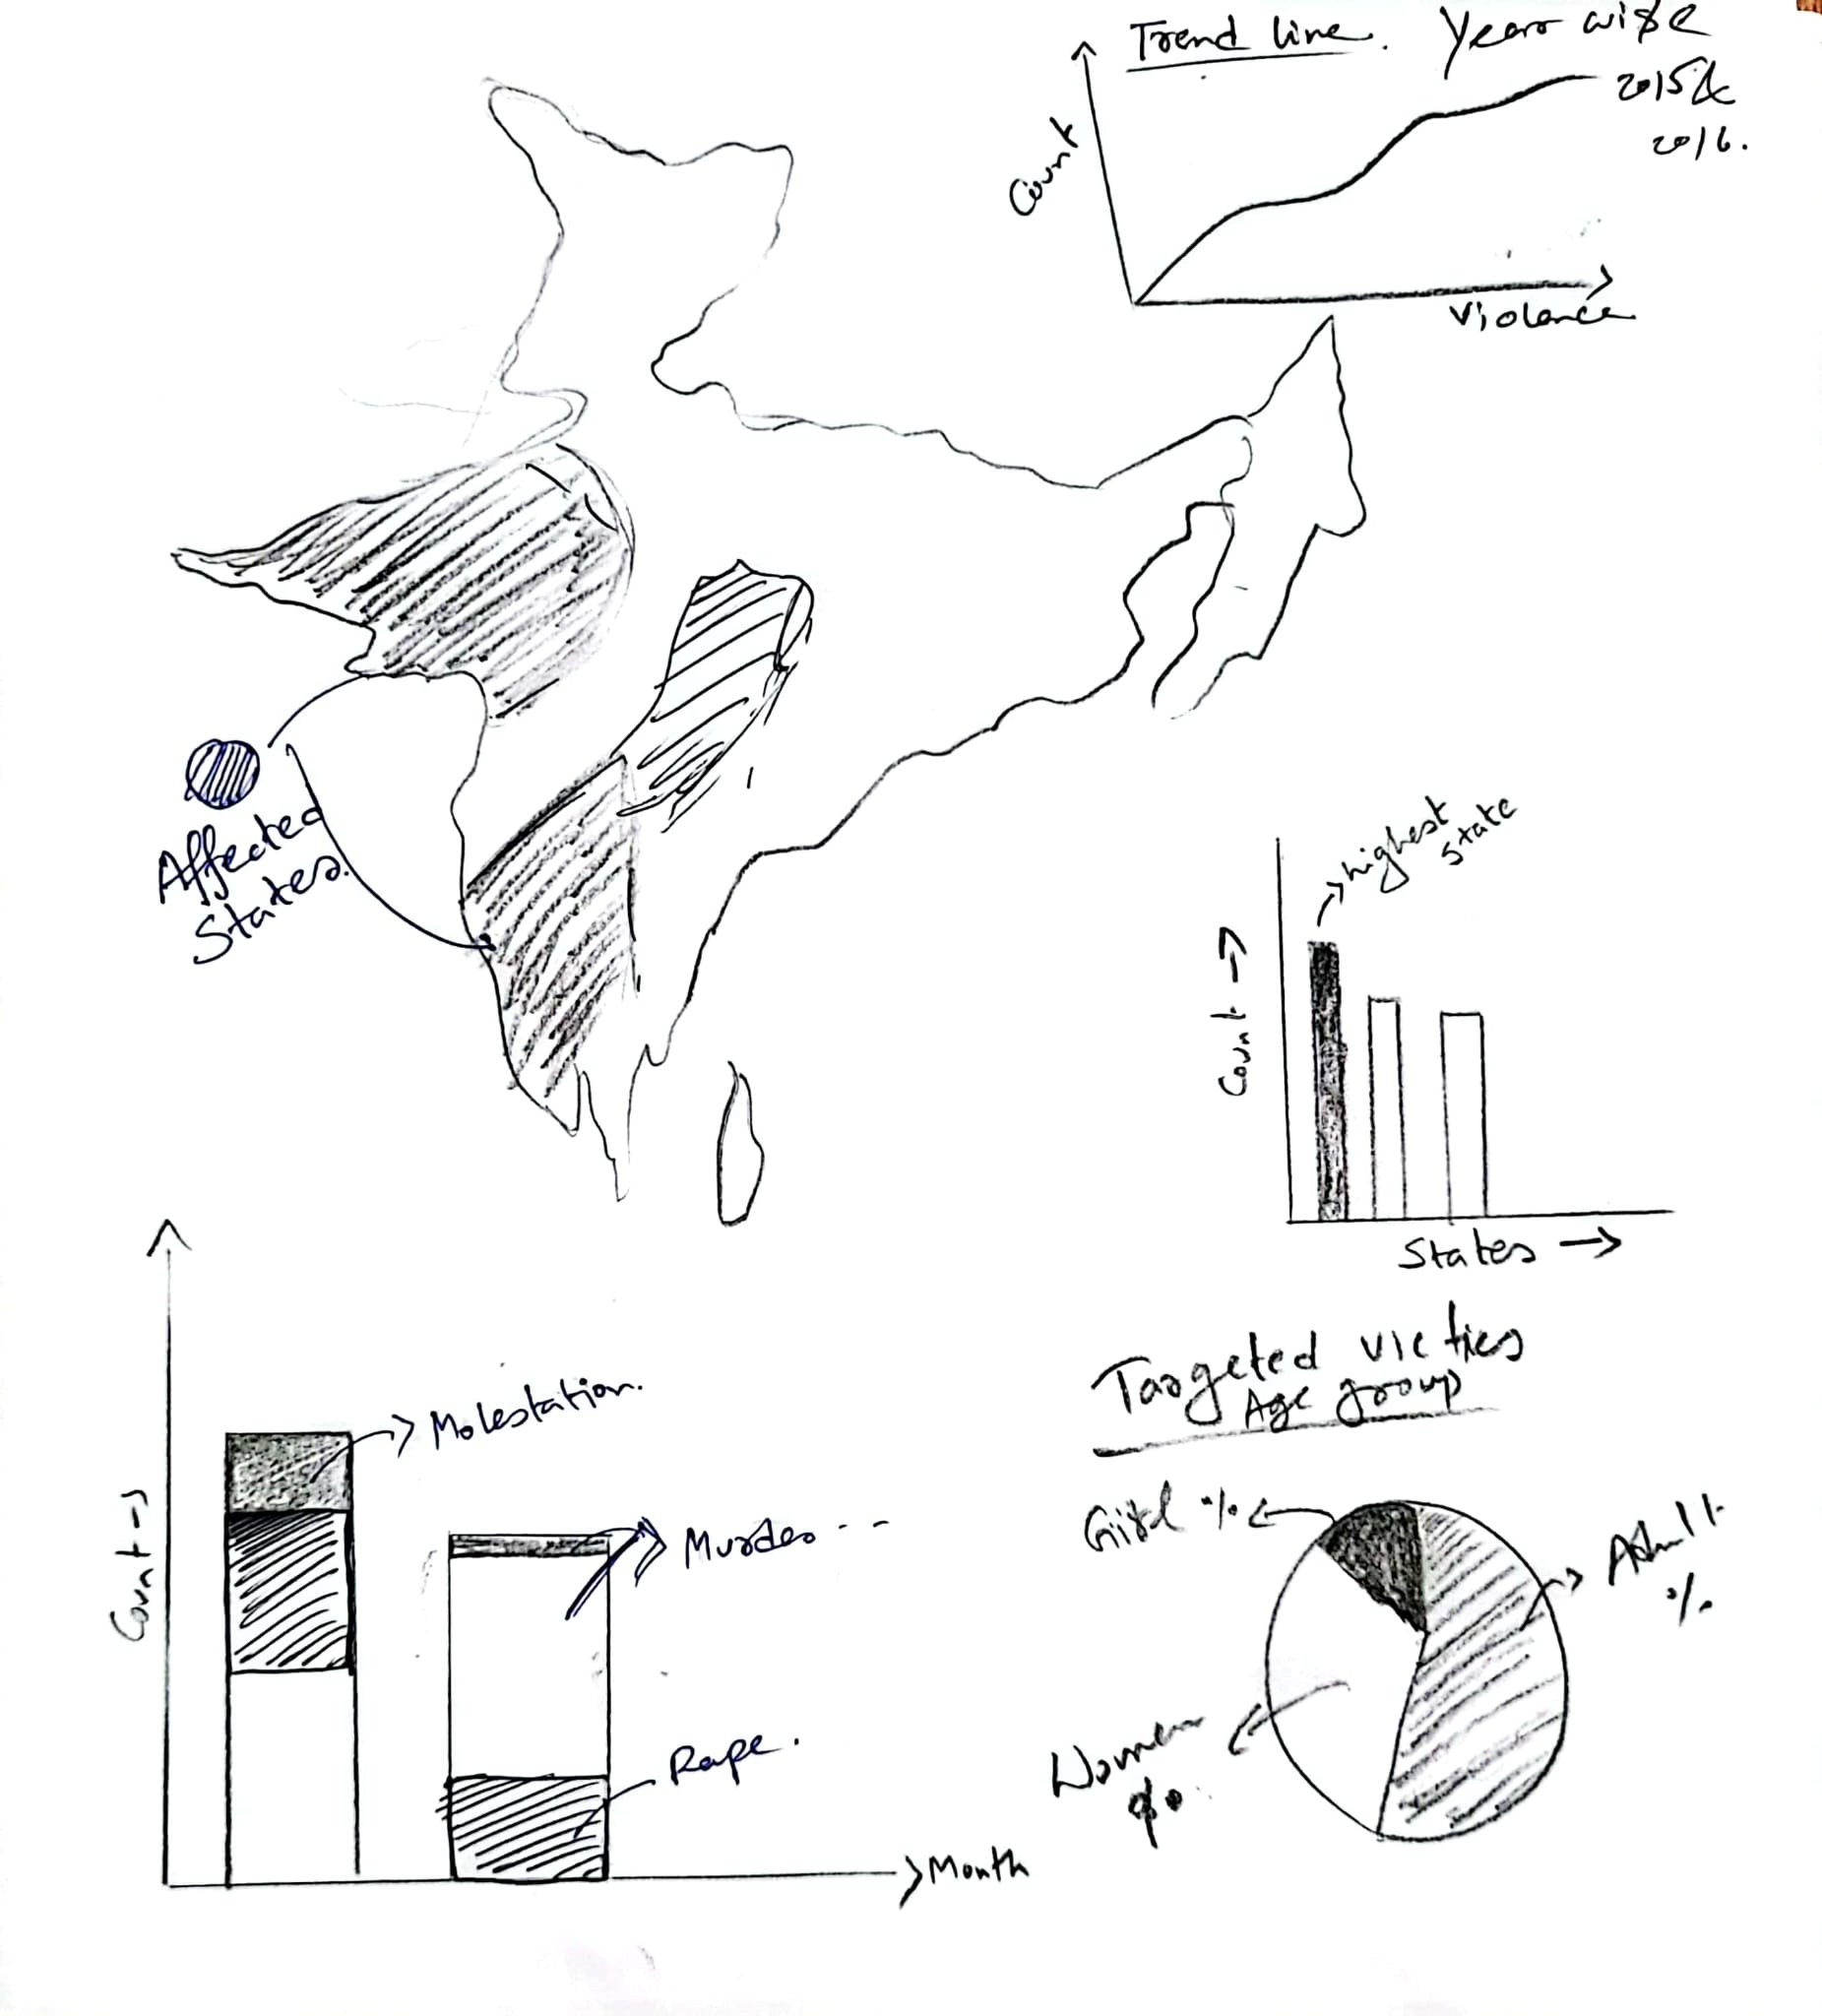
I used a two-step approach to display data and observations from various datasets, including information obtained from websites.
I started by sketching visualizations to determine the best representation method and effectively communicate insights.
Once I had a clear understanding, I turned the sketches into polished graphics to effectively convey the information to the audience.


Visulaizations
Key Learnings